
- The inventory of homes for sale increased again in June, the largest increase in the data’s history.
- The national inventory of active listings increased by 18.7% over last year, while the total inventory of unsold homes, including pending listings, still declined by 1.4% due to a decline in pending inventory.
- The inventory of active listings was down 34.1% compared to June 2020 in the early days of the COVID-19 pandemic, and down 53.2% compared to June 2019. In other words, there are a little less than two-thirds the number of homes available compared to June 2020, and less than half compared to June 2019.
- More new listings entered the market in June compared to last year, though slightly down from May new listing growth.
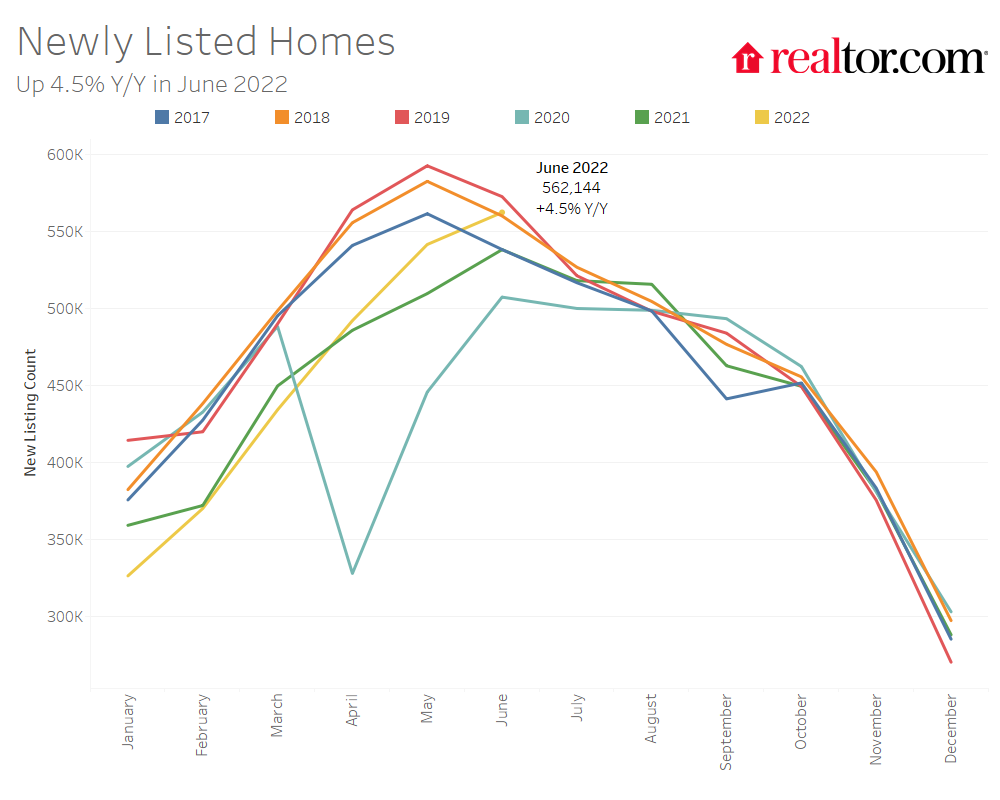
- Newly listed homes were up 4.5% nationally compared to a year ago, and up 3.1% for large metros over the past year.
- Sellers listed at roughly the same rate as 2017 to 2019, prior to the pandemic, up slightly by 1.0%.
- Housing remains expensive and fast-paced with the median asking price at a new high while time on market is up just one day from last month’s record low.
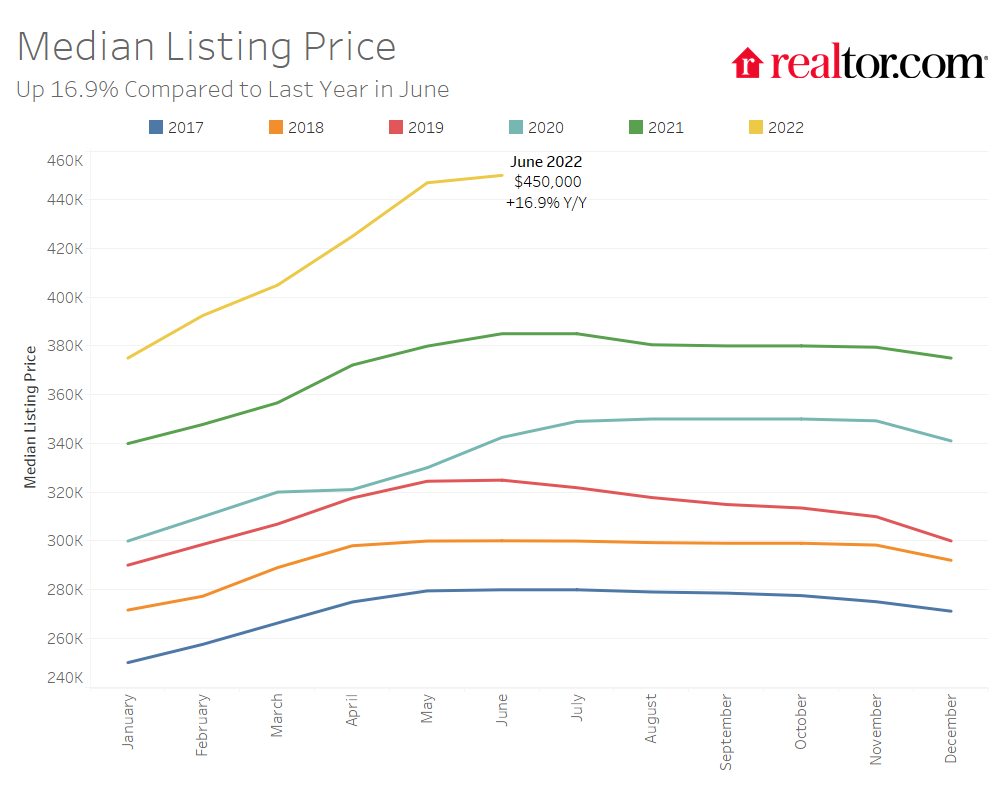
- The June national median listing price for active listings was $450,000, up 16.9% compared to last year and up 31.4% compared to June 2020.
- In large metros, median listing prices grew by 13.3% compared to last year, on average.
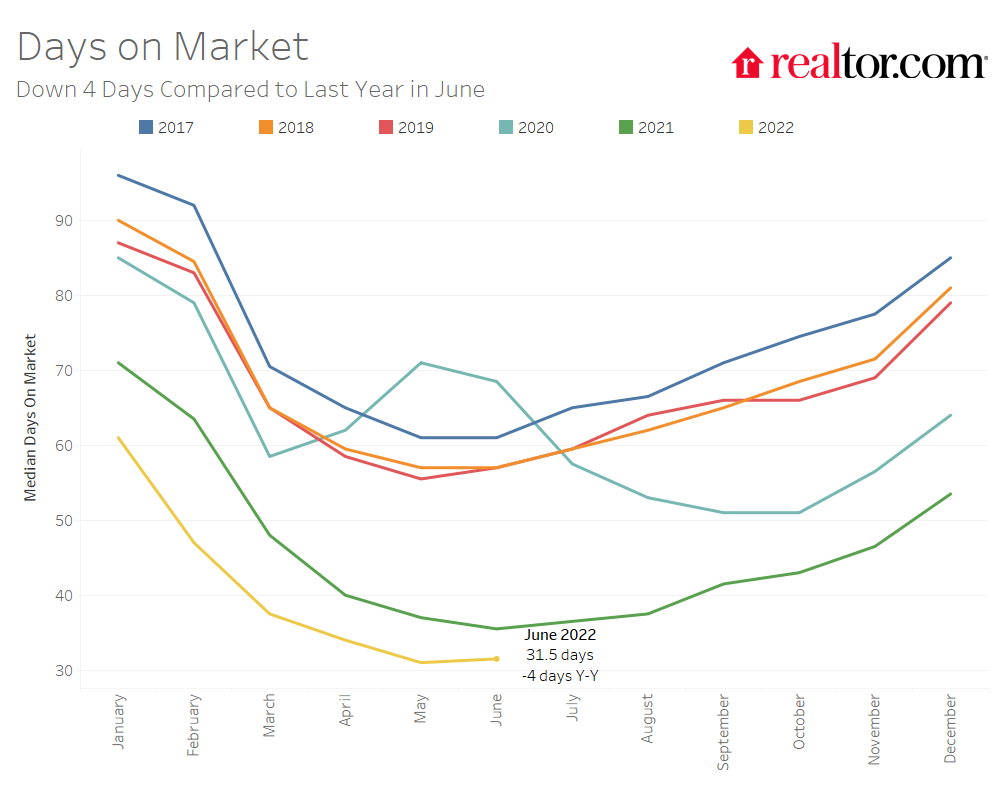
- Nationally, the typical home spent 32 days on the market in June, down 4 days from the same time last year and down 37 days from June 2020.
Realtor.com®’s June housing data release shows a continued improvement in housing inventory for the second month, with the count of home listings actively for sale growing compared to last year by the largest margin in the data’s history. This turnaround in inventory is being driven by both sellers entering the market and by moderating demand. Newly listed homes entered the market at a higher rate (+4.5% year-over-year) than in the recent past, though slightly slower compared to May, when newly listed homes increased by 6.3% year-over-year. Moderating demand has taken a larger toll this month, with pending listings declining sizably (-16.3% year-over-year) compared to last year. Nonetheless, homes are still spending less time on the market compared to last year and prices are still rising, partially driven by an increase in newly listed larger homes and slow adjustments to seller expectations.
Inventory Sees Growth Amidst Moderating Demand
Nationally, the inventory of homes actively for sale on a typical day in June increased by 18.7% over the past year, the largest increase in inventory in the data history. This amounted to 98,000 more homes actively for sale on a typical day in June compared to the previous year. While overall active housing inventory grew year-over-year, the inventory of condos (along with other attached home types) listed for sale shrank by -0.2%. Condos, which made up 20.2% of listings in June, tend to be lower-priced than single-family homes (17.5% cheaper on average in the 50 largest metro areas in June 2022) and have therefore gained popularity in high-priced locales as single-family home prices have climbed in recent years. The total number of unsold homes nationwide—a metric that includes active listings and listings in various stages of the selling process that are not yet sold—was still down 1.4% percent from June 2021. However this has improved from last month’s 3.9% decline.

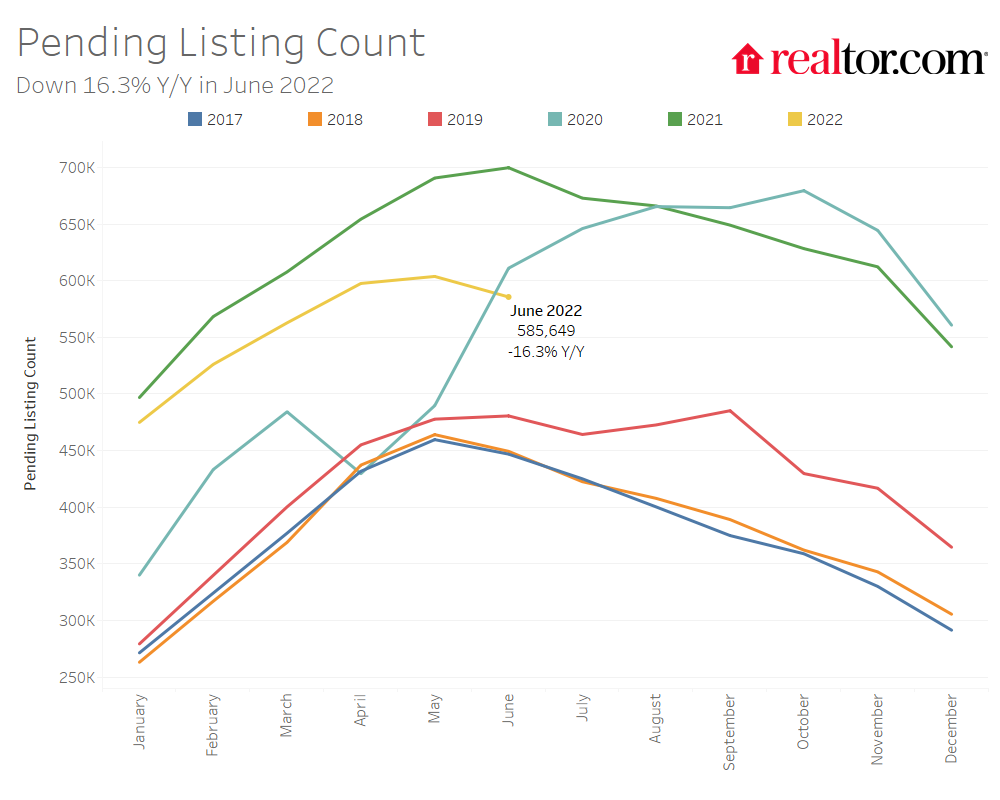
The lagged improvement in the total number of homes for sale is due to moderating buyer demand, spurred by rising interest rates and all-time high listing prices that have increased the cost of financing 80% of the typical home by 57.6% ($745 per month) compared to a year ago. The number of pending listings on a typical day (listings that are at various stages of the selling process that are not yet sold), has declined by 16.3% compared to last June, indicating that a moderation in demand is also softening the rate of turnover in inventory. This is a further deceleration from the 12.6% annual decline we reported for May. For homebuyers who are still actively searching for a home, lower competition and more seller activity will provide some relief.
In June, newly listed homes increased above last year’s levels by 4.5%, slightly down from May’s 6.3% increase. Sellers were listing at rates similar to what was typical of 2017 to 2019 June levels but have increased by 1.0% from what was typical in June 2017 to 2019.
The inventory of homes actively for sale in the 50 largest U.S. metros overall increased by 27.9% over last year in June. The inventory of homes in large Northeastern metros was slightly higher (+3.2% year-over-year) compared to last year while other regions saw stronger growth. In the West, active listings grew most (by +52.3% year-over-year), followed by the South (+37.5%), and Midwest (+6.2%). Large Southern metros saw new listings increase by an average of 11.0% compared to last year, while northeastern and midwestern metros saw a decrease in new listings (-6.0% and -4.4%, respectively) compared to last year. New listings in the West grew more modestly by 2.8% compared to last year.
Inventory increased in 40 out of 50 of the largest metros compared to last year. Metros which saw the most inventory growth include Austin (+144.5%), Phoenix (+113.2%), and Raleigh (+111.7%), all of which experienced booming demand during the pandemic. Inventory is still declining on a year-over-year basis in 10 markets, with Miami (-15.9%), Virginia Beach (-14.4%), and Chicago (-13.0%) still seeing the largest declines.
Half of the 50 largest metros also saw the number of newly listed homes increase compared to last year, down from 30 in May. The markets which saw the highest year-over-year growth in newly listed homes included southern metros such as Raleigh (+7.6%), Nashville (+37.2%) and Charlotte (+30.1%), as well as Las Vegas (+34.8%). Markets which are still seeing a decline in newly listed homes compared to last year include San Jose (-19.5%), Milwaukee (-18.7%), and Baltimore (-18.5%).
Some Metros Are Seeing Time on Market Increase, but in Most Homes Are Still Selling More Quickly
The typical home spent 32 days on the market this June which is 4 days less than last year. Homes spent 27 fewer days on the market than typical June 2017 to 2019 timing.
In the 50 largest U.S. metros, the typical home spent 28 days on the market, and homes also spent 2 fewer days on the market, on average, compared to June 2021. Among these 50 largest metros, the time a typical property spent on the market decreased most in large metros in the South (-4 days), followed by the Northeast and West (-2 days), and the Midwest (-1 day).
Ten of the 50 largest metros saw time on market increase compared to the previous year, and six saw no change in time on market year-over-year. Among these larger metropolitan areas, homes saw the greatest yearly decline in time spent on market in Miami (-22 days), and Hartford (-8 days). Atlanta, Jacksonville and Orlando all tied with the typical home spending 7 fewer days on the market than the previous year. Austin saw time on market increase the most, by 6 days, while Denver and Detroit tied with the typical home in each of these metros spending 4 more days on the market than the previous year.
Listing Prices Are Still Rising, Newly Listed Homes Are Larger
The median national home price for active listings grew to a new all-time high of $450,000 in June. This represents an annual growth rate of 16.9%, a slight deceleration from last month’s growth rate of 17.6%. However, the median listing price for a typical 2,000 square-foot single family home rose 21.6% compared to last year, similar to last month’s 21.5% increase.
Given growing supply and softness in sales and pending listings, the median listing price deceleration is signaling that seller expectations may be beginning to adjust to shifting market conditions. However, the slight price deceleration relative to the sizable (-16.3%) decrease in pending listings (signifying reduced demand) suggests that the median list price is impacted by other factors in addition to demand. The share of newly listed smaller homes (up to 1750 square feet) declined from 47.3% last June to 45.7% this June, while the share of homes larger than 1750 square feet increased from 52.7% to 54.3%. Because of these newly listed homes, larger, more expensive homes make up a bigger share of what’s for-sale this year than last year, leading to slower price deceleration than expected based on softening demand. In addition, the median list price of listings in pending status–those homes for which the seller has already accepted a buyer’s offer to purchase–decelerated, from a year-over-year rate of 16.2% in May to a growth rate of 13.9% in June. This indicates that the homes which buyers are choosing to buy tend to be less expensive, and also suggests that sellers have started to adjust their expectations to market conditions.
There are ongoing signs of this price adjustment. The share of homes having their price reduced increased from 7.6% last June to 14.9% this year, but still remains 3.2 percentage points below typical 2017 to 2019 levels. All but one of the largest 50 metros saw an increasing share of price reductions in June.

Active listing prices in the nation’s largest metros grew by an average of 13.3% compared to last year. Miami (+40.1%), Orlando (+30.6%), and Nashille (+30.6%), posted the highest year-over-year median list price growth in June, though all saw a deceleration in year-over-year growth compared to May. Large western metros saw the greatest increase in the share of price reductions (+14.3 percentage points), followed by southern metros (+7.7 percentage points). Homes in Austin (+24.7 percentage points), Phoenix (+22.2 percentage points) and Las Vegas (+20.1 percentage points) showed the greatest growth in the share of homes with price reductions compared to last year.
June 2022 Regional Statistics (50 Largest Metro Combined Average)
| Region | Active Listing Count YoY | New Listing Count YoY | Median Listing Price YoY | Median Listing Price Per SF YoY | Median Days on Market Y-Y (Days) | Price Reduced Share Y-Y (Percentage Points) |
| Midwest | 6.2% | -4.4% | 9.7% | 8.7% | -1 day | 3.5% |
| Northeast | 0.3% | -6.0% | 4.7% | 7.8% | -2 days | 3.2% |
| South | 37.5% | 11.0% | 18.8% | 16.6% | -4 days | 7.7% |
| West | 52.3% | 2.8% | 13.2% | 11.9% | -2 days | 14.3% |
June 2022 Housing Overview by Top 50 Largest Metros
| Metro | Median Listing Price | Median Listing Price YoY | Median Listing Price per Sq. Ft. YoY | Active Listing Count YoY | New Listing Count YoY | Median Days on Market | Median Days on Market Y-Y (Days) | Price Reduced Share | Price Reduced Share Y-Y (Percentage Points) |
| Atlanta-Sandy Springs-Roswell, Ga. | $445,000 | 12.7% | 13.5% | 23.4% | 5.6% | 26 | -7 | 14.0% | 7.6% |
| Austin-Round Rock, Texas | $620,000 | 18.7% | 15.7% | 144.5% | 26.6% | 22 | 6 | 32.4% | 24.7% |
| Baltimore-Columbia-Towson, Md. | $365,000 | 6.6% | 5.6% | 1.2% | -18.5% | 32 | 0 | 13.3% | 4.1% |
| Birmingham-Hoover, Ala. | $295,000 | 8.4% | 11.4% | 25.5% | 1.0% | 33 | -4 | 11.0% | 5.1% |
| Boston-Cambridge-Newton, Mass.-N.H. | $759,000 | 8.6% | 2.7% | 0.4% | -5.0% | 21 | -2 | 15.2% | 4.8% |
| Buffalo-Cheektowaga-Niagara Falls, N.Y. | $245,000 | -2.0% | 3.2% | 12.8% | -0.3% | 23 | -2 | 7.0% | 2.2% |
| Charlotte-Concord-Gastonia, N.C.-S.C. | $445,000 | 14.2% | 15.1% | 36.7% | 30.1% | 29 | 2 | 13.1% | 3.5% |
| Chicago-Naperville-Elgin, Ill.-Ind.-Wis. | $365,000 | 2.8% | 1.7% | -13.0% | -11.4% | 30 | -4 | 12.0% | 2.6% |
| Cincinnati, Ohio-Ky.-Ind. | $330,000 | -5.7% | 2.9% | 4.6% | 1.1% | 28 | -4 | 9.2% | 2.2% |
| Cleveland-Elyria, Ohio | $225,000 | 2.7% | 7.5% | -1.7% | -2.0% | 36 | 1 | 10.2% | 2.5% |
| Columbus, Ohio | $350,000 | 16.7% | 13.7% | 11.6% | -1.5% | 17 | 2 | 12.9% | 3.6% |
| Dallas-Fort Worth-Arlington, Texas | $486,000 | 25.5% | 20.1% | 61.6% | 27.6% | 24 | -5 | 16.9% | 10.2% |
| Denver-Aurora-Lakewood, Colo. | $680,000 | 13.3% | 5.7% | 58.3% | 2.4% | 15 | 4 | 21.3% | 14.8% |
| Detroit-Warren-Dearborn, Mich. | $285,000 | 2.0% | 5.5% | 18.2% | -0.3% | 24 | 4 | 17.1% | 6.8% |
| Hartford-West Hartford-East Hartford, Conn. | $375,000 | 10.9% | 21.4% | N/A | -12.5% | 21 | -8 | 6.5% | -0.7% |
| Houston-The Woodlands-Sugar Land, Texas | $399,000 | 9.1% | 10.3% | 10.1% | 1.7% | 33 | -4 | 15.6% | 7.0% |
| Indianapolis-Carmel-Anderson, Ind. | $320,000 | 15.5% | 13.8% | 22.3% | 10.6% | 30 | -6 | 13.2% | 4.2% |
| Jacksonville, Fla. | $450,000 | 28.6% | 26.0% | 38.3% | 5.2% | 30 | -7 | 14.1% | 8.0% |
| Kansas City, Mo.-Kan. | $400,000 | 20.5% | 13.9% | 27.5% | 2.0% | 39 | 1 | 8.4% | 1.8% |
| Las Vegas-Henderson-Paradise, Nev. | $499,000 | 24.9% | 24.4% | 45.2% | 34.8% | 25 | -1 | 30.6% | 20.1% |
| Los Angeles-Long Beach-Anaheim, Calif. | $975,000 | 2.1% | 6.4% | 20.1% | -1.9% | 29 | -5 | 15.1% | 9.3% |
| Louisville/Jefferson County, Ky.-Ind. | $300,000 | 8.1% | 8.8% | 21.9% | 1.1% | 23 | 0 | 14.2% | 5.8% |
| Memphis, Tenn.-Miss.-Ark. | $307,000 | 28.5% | 31.0% | 33.1% | 6.4% | 32 | -4 | 10.0% | 4.6% |
| Miami-Fort Lauderdale-West Palm Beach, Fla. | $630,000 | 40.1% | 24.5% | -15.9% | 4.1% | 38 | -22 | 11.9% | 6.1% |
| Milwaukee-Waukesha-West Allis, Wis. | $372,000 | 24.2% | 12.9% | -4.1% | -18.7% | 29 | 0 | 10.4% | 2.2% |
| Minneapolis-St. Paul-Bloomington, Minn.-Wis. | $420,000 | 15.1% | 8.8% | -0.5% | -10.1% | 30 | -1 | 11.3% | 5.2% |
| Nashville-Davidson–Murfreesboro–Franklin, Tenn. | $561,000 | 30.6% | 18.0% | 85.6% | 37.2% | 15 | 1 | 17.7% | 10.4% |
| New Orleans-Metairie, La. | $350,000 | 1.5% | 2.9% | 15.5% | 2.0% | 40 | -6 | 18.1% | 7.8% |
| New York-Newark-Jersey City, N.Y.-N.J.-Pa. | $700,000 | 9.4% | 19.2% | 0.3% | -2.2% | 45 | 0 | 11.3% | 2.6% |
| Oklahoma City, Okla. | $321,000 | 11.8% | 19.1% | 37.2% | 26.8% | 32 | -5 | 10.8% | 2.7% |
| Orlando-Kissimmee-Sanford, Fla. | $464,000 | 30.6% | 24.9% | 30.8% | 17.9% | 30 | -7 | 14.7% | 7.6% |
| Philadelphia-Camden-Wilmington, Pa.-N.J.-Del.-Md. | $349,000 | 4.2% | 7.2% | -2.3% | -8.7% | 37 | 0 | 13.3% | 4.4% |
| Phoenix-Mesa-Scottsdale, Ariz. | $549,000 | 18.0% | 18.8% | 113.2% | 19.5% | 25 | -4 | 29.5% | 22.2% |
| Pittsburgh, Pa. | $240,000 | -8.6% | -0.7% | 4.2% | -6.9% | 37 | -4 | 14.6% | 4.8% |
| Portland-Vancouver-Hillsboro, Ore.-Wash. | $600,000 | 8.1% | 9.1% | 30.7% | -1.6% | 28 | -2 | 21.4% | 11.6% |
| Providence-Warwick, R.I.-Mass. | $477,000 | 12.4% | 10.1% | 6.3% | -1.9% | 23 | -2 | 9.2% | 4.6% |
| Raleigh, N.C. | $500,000 | 21.9% | 17.4% | 111.7% | 37.6% | 15 | -1 | 14.3% | 10.9% |
| Richmond, Va. | $397,000 | 13.4% | 10.2% | -6.3% | -9.0% | 34 | -3 | 7.9% | 3.3% |
| Riverside-San Bernardino-Ontario, Calif. | $599,000 | 13.1% | 15.1% | 71.7% | 7.9% | 30 | 0 | 19.8% | 14.8% |
| Rochester, N.Y. | $230,000 | -5.9% | 3.3% | -3.7% | -3.3% | 12 | 1 | 9.6% | 0.8% |
| Sacramento–Roseville–Arden-Arcade, Calif. | $643,000 | 8.3% | 9.0% | 65.0% | -5.6% | 27 | 2 | 25.2% | 17.5% |
| San Antonio-New Braunfels, Texas | $399,000 | 23.2% | 20.3% | 53.7% | 11.5% | 33 | -2 | 15.0% | 8.7% |
| San Diego-Carlsbad, Calif. | $949,000 | 16.8% | 13.9% | 25.5% | -5.2% | 22 | -4 | 17.6% | 11.5% |
| San Francisco-Oakland-Hayward, Calif. | $1,150,000 | 6.5% | 7.3% | 46.3% | -4.2% | 25 | -4 | 15.0% | 10.3% |
| San Jose-Sunnyvale-Santa Clara, Calif. | $1,489,000 | 14.7% | 10.1% | 33.5% | -19.5% | 23 | -1 | 17.3% | 11.9% |
| Seattle-Tacoma-Bellevue, Wash. | $822,000 | 19.6% | 10.7% | 65.6% | 4.8% | 22 | -4 | 18.1% | 13.5% |
| St. Louis, Mo.-Ill. | $282,000 | 8.7% | 8.2% | 5.2% | -9.8% | 37 | -5 | 10.4% | 2.6% |
| Tampa-St. Petersburg-Clearwater, Fla. | $447,000 | 27.9% | 24.3% | 55.9% | 12.4% | 29 | -4 | 18.7% | 11.6% |
| Virginia Beach-Norfolk-Newport News, Va.-N.C. | $359,000 | 14.0% | 12.2% | -14.4% | -7.1% | 22 | -1 | 14.4% | 4.3% |
| Washington-Arlington-Alexandria, DC-Va.-Md.-W. Va. | $593,000 | 13.0% | 3.1% | 2.5% | -15.8% | 28 | -1 | 14.6% | 6.4% |
Note: Hartford active listing count growth is not available due to data inconsistencies.
Subscribe to our mailing list to receive updates and notifications on the latest data and research.